
International C2 Journal: Issues
Vol 1, No 1 (2007)
Effects of Individual and Team Characteristics
on the Performance of Small Networked Teams
Abstract
Command and Control in the twenty-first century is characterized by transformation from hierarchical industrial age C2 to networked information age C2 concepts. While a requisite information infrastructure is widely recognized as an enabler of networked C2, the contribution of humans to C2 performance is still underestimated. The authors argue that knowledge of how and to what degree characteristics of individuals and teams affect networked C2 and collective action, both in teams and between coalition forces, is indispensable for an efficient implementation of information age C2 concepts. This paper presents results of an empirical study aimed at uncovering the effects of selected individual and team characteristics on collaboration in and effectiveness of small networked teams by means of standard psychological tests and simulation experiments. The study involved 130 teams, of four cadets and junior military officers of the German Bundeswehr each, tasked to locate and designate targets distributed over a simplified terrain grid in a simulated operation. The results show whether and to what degree personality structures, both on the individual and team level, affect team collaboration measured in terms of shared situational awareness and task performance. Also, the findings support the value chain underlying the concept of Network-Enabled Capability (NEC).
Introduction
The concept of Network-Enabled Capability (NEC) has been widely adopted and NATO as well as military organizations around the world are in the process of developing and implementing NEC-related capabilities. The development of NEC requires investments in both information-related infrastructure and in developing new approaches involving changes in organization, doctrine, and processes. However, while considerable resources and efforts are being devoted to improving information and communications-related technologies there has been relatively little effort devoted to understanding the behaviors and performance of teams in a networked environment.
The NATO study group SAS-050 on “Exploring New Command and Control Concepts and Capabilities” developed a conceptual model of C2 that identifies the variables thought to be important in terms of the NEC value chain that includes the NEC-relevant relationships between and among the set of variables that influence the value of a C2 approach. A major part of this model involves individual and team characteristics.
These characteristics are thought to have significant influence on information sharing and collaboration. These are necessary to improve shared awareness and to leverage the awareness achieved to improve mission effectiveness. A better understanding of the relationships between and among individual and team characteristics and the variables identified in the tenets underlying NEC will be necessary to fully leverage the investments being made in improving the information infrastructure and to support the development of new approaches to C2. Thus, at the core of the research described in this paper are questions of how individual and team characteristics affect collaboration in networked C2 teams and what team composition supports building shared awareness and the quality of collective decision-making and team performance measured in terms of task effectiveness. The research design essentially involved the developments of a set of hypotheses on relationships between team performance and selected individual and team characteristics to be tested in a team collaboration experiment using a computer simulation fairly typical for problems facing tactical level C2 of network-enabled operations. The experiment required members of a spatially distributed team to jointly locate hidden targets based on the results obtained from the allocation of reconnaissance resources.
Theoretical Background and Hypotheses
Selected individual characteristics were hypothesized to affect team performance: Locus of Control, Ambiguity Tolerance, and the four personality dimensions underlying the Myers-Briggs-Type indicator (MBTI®) typology, i.e. Extraversion-Introversion, Sensing-Intuition, Thinking-Feeling, and Judging-Perceiving. The MBTI® is a widely used personality assessment instrument based on C.G. Jung’s (1921) theory of psychological types. Combining an individual’s preferences on these four dimensions leads to the individual’s type. Thus, personality assessment based on this concept reveals categorical rather than continuous data. Although it is suggested that the distribution of preferences and types in a team affects team performance (e.g., Bradley and Hebert 1997), continuous data may be used as well when personality structure is to be related to other variables (Gardner and Martinko 1996; Myers 1993; Thatcher and De La Cour 2003).
Extraversion versus Introversion
Extraversion and Introversion play a central role in personality research and assessment. Introverted individuals are mainly interested in the inner world of concepts and ideas, show thoughtful detachment, and enjoy solitude and privacy. In team situations they tend to keep information to themselves rather than to communicate openly (Kroeger and Thuesen 1992). Extraverted individuals are energized by interaction with others, rely on the environment for stimulation and guidance, are action-oriented and sometimes impulsive, frank and sociable, and find it easy to communicate (Myers and McCaulley 1992). Accordingly, extraversion was shown to be positively related to levels of participation in the team and the number of verbal exchanges between team members (Barry and Stewart 1997).
The team task used in this study requires individuals to process information on external stimuli, and to cooperate by exchanging information and coordinating action. Extraverted team members may thus find it easier than introverted individuals to accomplish the team task. A strong tendency toward Extraversion on the team level may facilitate communication and coordination in the team, which may in turn positively affect team performance.
Hypothesis 1: A team’s preference for Extraversion is positively related with team performance.
Sensing versus Intuition
Individuals who prefer Sensing tend to focus on immediate experiences, facts, and details. They show realism, good memory for details, and practicality. Intuitive individuals tend to be more imaginative, theoretical, abstract, and future oriented. They focus on possibilities, meanings, and relationships by way of insight. (Myers 1993).
Individuals oriented toward Sensing should be able to process these stimuli from the physical environment in a detail-focused and differentiated way, resulting in greater effectiveness in reacting to well-structured situations and problems, and when consequences of decisions are rather predictable. Intuitive individuals may be more effective in solving unstructured, ill-defined problems that require consideration of developments that are hard to predict and creative problem solutions. Thus, individuals who prefer Sensing may perform better in the task used in this study.
Hypothesis 2: A team’s preference for Sensing is positively related to team performance.
Thinking versus Feeling
Individuals who prefer Thinking tend to rely on principles of cause and effect and to be impersonal and detached. Individuals preferring Feeling are more subjectively oriented and tend to reach decisions by weighing an issue’s relative values and merits. They try to understand personal and group values and make decisions by attending to others’ needs (Myers 1993).
The task used in this study requires team members to logically conclude from observations and information on actions that have to be taken. Team members primarily exchange objective information on their observations and communicate to coordinate their actions based on these observations. Team members’ values and needs play a subordinate role in this task so that teams consisting of individuals who prefer Thinking may be more effective in accomplishing the task.
Hypothesis 3: A team’s preference for Thinking is positively related with team performance.
Judgment versus Perception
Individuals who prefer Perception are attuned to incoming information, open for new experiences and change, and curious and interested in a wide range of issues. They strive to miss nothing, find it easy to adapt, and tend to behave in a spontaneous manner. Individuals who prefer Judging are primarily concerned with making decisions and tend to end information intake as soon as they are convinced they have observed enough to be able to make a reasonable decision. Most often, they appear to act in an organized, purposeful, and decisive manner.
With a view to the characteristics and requirements of the team task used in this study, individuals who prefer Judging may perform better.
Hypothesis 4: A team’s preference for Judgment is positively related with team performance.
Locus of Control (LOC)
This personality trait refers to an individual’s generalized belief in their capability to control achievable reinforcement (Rotter 1966). Individuals with internal LOC (internals) consider themselves as masters of their fate. They believe in their capability to influence their environment and consequences of their behaviour. Individuals with external LOC (externals) are convinced that favourable or unfavourable events in their lives originate in uncontrollable external forces such as fate or powerful others.
Results of both experimental and field research indicate that, when concerned with decision-making tasks, internals gather more information and process information more effectively than externals. Boone et al. (2005) found the mean score of the team members’ internality (internal LOC) to be positively related to the amount of information gathered by team members, and a team’s information acquisition positively predicted team performance measured in terms of return on equity.
The team simulation used in this study requires acquisition and processing of a considerable amount of information that may be accomplished by teams more easily the higher their members’ internality is.
Hypothesis 5: A team’s internality is positively related with team performance.
Ambiguity Tolerance
With a view to the complexity and dynamics of the global security environment, uncertainty and ambiguity are increasingly becoming organizational reality which decision makers need to adapt to (Huber and Eggenhofer 2005). Ambiguity Tolerance refers to the way an individual perceives and processes information about ambiguous stimuli when confronted with unfamiliar, complex, or incongruent clues (Furnham and Ribchester 1995). Individuals high in Ambiguity Tolerance tend to perceive ambiguous stimuli as desirable, challenging, and interesting whereas individuals low in Ambiguity Tolerance easily experience stress and avoid ambiguous stimuli.
Although this may have relieving effects for individuals low in Ambiguity Tolerance, avoidance may restrict the individual’s field of awareness and spectrum of behavioural alternatives (Furnham and Ribchester 1995). This notion plays a key role in the networked operations context of this study. The task to detect targets with only limited material and time resources implies significant ambiguity and the risk of failure. It would be ineffective to avoid facing the ambiguous situation and the risks associated with the ambiguity. In fact, ambiguity tolerance has been consistently found to be negatively related to risk aversion, i.e. individuals who tolerate ambiguity are less risk averse than individuals low in ambiguity tolerance (e.g., Lauriola and Levin 2001). However, individuals highly tolerant of ambiguity may as well take too high risks, which may impair decision quality and performance. Thus, the relationship between team performance and the team members’ ambiguity tolerance may be of an inverted U-shaped nature.
Hypothesis 6: Teams with a medium level of Ambiguity Tolerance perform better than teams with a low or high level of Ambiguity Tolerance.
Team-specific Characteristics and Team Performance
In contrast to individual team members’ characteristics that need to be aggregated to reflect some team-level measure, team-specific characteristics directly operate on the team level. Among the most influential team characteristics is team cohesion, which is distinguished into task cohesion and social cohesion (e.g., Wellens 1993).
Social Cohesion
Social cohesion leads to team members’ enjoying to work with each other and being positive about coming back to work with their original team on a different task in the future (Chang and Bordia 2001). Generally, extremely high social cohesion may lead to groupthink (Janis 1982), a phenomenon characterized by exceptionally strong group norms to preserve consensus among team members in that information and opinions deviating from the team’s shared mental model are neglected or denied, which may finally result in deficient decision-making (Jones and Roelofsma 2000; Postmes, Spears and Cihangir 2001). Since individuals in this study were randomly assigned to teams and interacted only for a short period, it is unlikely that social cohesion escalated to groupthink.
Hypothesis 7: Social cohesion is positively related to team performance.
Task Cohesion
Task cohesion refers to team members’ willingness to cooperate in order to achieve a shared goal. It was found to be an especially strong predictor of team performance (Chang and Bordia 2001). We assume that this will be also true for the particular team task used in this study.
Hypothesis 8: Task cohesion is positively related to team performance.
Research Design
The research design comprised four steps (Figure 1):
- Theory-based development of hypotheses specifying the relationships between potential determinants and team performance measures.
- Data collection using:
- questionnaires to measure the independent variables (hypotheses 1–6);
- collaboration experiments involving teams of four participants tasked to cooperatively plan and implement actions in a simulation experiment; and
- questionnaires to measure team-specific variables (hypotheses 7–8).
- Data analysis comprising the description of the data and tests of the hypotheses (step 3a). The qualitative data collected during the simulation games are analysed in step 3b (not covered in this paper) to gain additional insights into relevant team processes.
- Discussion of results and conclusions.
The main body of the sample consisted of 520 students of the German Air Force officer school who individually provided data on the independent variables and were randomly grouped into teams of four participants for the collaboration experiments. The functionality of the research design was tested in a pre-investigation involving 60 junior officers pursuing an academic education at the Universität der Bundeswehr München. Their data are incorporated in the results presented in this paper.

Figure 1. Research Design.
Measurement of the Independent Variables
MBTI® Personality Structure
MBTI® personality structure was measured using the MBTI® Step I (European Version), an 88-item forced choice instrument. Reliability in terms of Cronbach’s Alpha is reported to amount to between .80 and .84 (Kendall 1998). In this study, three coefficients were between .81 and .82 and thus satisfactory, whereas the reliability of Sensing-Intuition only reached .67 which is slightly below the widely acknowledged acceptability limit of .70 (Nunnally 1978) and warrants cautious interpretation of the related results.
Locus of Control
Locus of Control was measured using a German translation of Rotter’s (1966) Locus of Control scale, a 23-item forced-choice scale with reported reliability scores between .69 and .76 (Furnham and Steele 1993). A sample item from the scale is: “What happens to me is my own doing” (indicating internal LOC) versus “Sometimes I feel that I don’t have enough control over the direction my life is taking” (indicative of an external LOC). Cronbach Alpha in this study was .74, which can be considered as satisfactory.
Ambiguity Tolerance
Ambiguity tolerance was measured with a scale developed from the MAT-50 (Norton 1975) and MacDonald’s (1970) revised AT scale. A sample item is “A problem has little attraction for me if I don’t think it has a solution.” Respondents rated the statements on a 6-point Likert scale (1 = strongly disagree; 6 = strongly agree). Cronbach Alpha was .76 and thus satisfactory.
Social Cohesion
Social cohesion was measured with four items, three of which were reproduced from Karau and Hart (1998, 188), for example asking team members how willing they would be to work with their fellow team members again in the future. An additional item asked how much the team members felt they had been integrated into the team. The statements were rated on a 6-point Likert-type rating scale (1 = strongly disagree; 6 = strongly agree). Scale reliability was .86 in this study.
Task Cohesion
Task cohesion was measured with four items adopted from Carless and De Paola (2000). A sample item was: “Our team was united in trying to reach its goal for performance.” Answers were rated on a 6-point Likert-type rating scale (1 = strongly disagree; 6 = strongly agree). The scale revealed a reliability of .81, which is considered good.
Control Variables
Variables considered as potential moderators of the relationships between the independent variables and the team performance measures were the team members’ average age and the teams’ gender composition, measured as the number of females in the team.
Furthermore, team members’ cognitive abilities are reported to be positively related to team performance (e.g., Barrick et al. 1998). In particular, the ability to understand the task and its rules and goals as well as task-specific abilities may play a role here. Accordingly, two subtests were selected from the intelligence battery I-S-T 2000-R (Amthauer, Brocke, Liepmann and Beauducel 2000) to estimate potential moderating effects of spatial ability (the capacity to find “one’s way around an unfamiliar environment”; Colman 2003, 695) and number aptitude (“facility with numerical and quantitative operations”, Reber and Reber 2001, 474). Internal consistency scores (Cronbach Alpha) of these subscales are reported to vary between .87 and .96 and showed satisfactory scores of .92 (numeral intelligence) and .71 (figural intelligence) in this study.
Collaboration Experiment: Measuring Dependent Variables/Team Performance
Team performance measures are obtained from a simple multi-player computer game called the Collaborative Game For First Experiences In A Networked Environment (CAFFEINE). It was developed by Schäfer (2005) and is currently used in the German Armed Forces to illustrate basic principles of the NCO value chain, that sharing of information enabled by a robust network increases shared awareness within a team and leads to significantly improved mission effectiveness.
The basic idea of the game is similar to the concept of StrikeCOM (Twitchell, Wiers, Adkins, Burgoon and Nunamaker 2005) or ScudHunt (Stahl and Loughran 2002). Teams of equal size (3 to 8 persons, 4 in this study[1]) have to solve a common task, where the team members are spatially separated but connected through a computer network offering different means of communication like voice and text chat, white board and a Common Result Picture (CRP). In each simulation experiment, the objective of the task is to search for a number of targets randomly distributed over a rectangular area divided into cells of equal size accommodating at most one target each (Figure 2). Each player owns a specific sensor portfolio that he/she may use to perform a number of reconnaissance rounds each limited by a fixed budget. Sensors differ in several attributes like the number and arrangement of cells they can cover, precision (detection and false alarm probability), and cost per deployment. The limited sensor capability and the uncertainty of results raise the need for communication and cooperation within the team to obtain the best possible reconnaissance (recce) picture and shared situational awareness of target locations. In contrast to an Individual Result Picture (IRP) CRP, if available, allows each team player to see immediately the search results of teammates on his/her individual screen. In the final round, each player is tasked to select all cells in which he/she suspects targets to be located based on the information available to him/her.
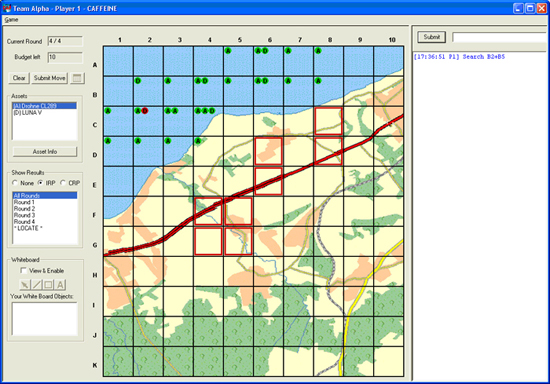
Figure 2. CAFFEINE Screenshot.
During each game, team activities (mainly chat conversation and moves/actions) and their outcomes are recorded on the basis of which of the following variables for assessing team collaboration and performance are compiled at the end of each game:
- Hit: Number of cells marked by the team that actually contain targets
- Fail: Number of cells marked by the team that do not contain targets (resulting in shots at empty cells)
- ChatMsg: Number of chat messages sent
- Time: Total time consumed to complete the task (seconds)
- Budget: Unused Reconnaissance Budget (virtual monetary units)
Team performance is assessed on the basis of functional relationships between appropriate measures of effectiveness or efficiency described in terms of the recorded game output variables.
While a linear additive weighted score function was used during the simulation games to provide individual teams with some feedback on their performance,[2] a comparative analysis of several functional forms suggested that, given the restrictive circumstances of data collection and the relative simplicity of the task to be performed by the teams, the following functions would be most appropriate for the assessment of team cooperation in terms of shared situational awareness (SSA) and team performance in terms of task efficiency (TEF):
|
i = index of cells |
(1) |
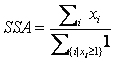
Equation (1) for measuring SSA was adopted from Stahl and Loughran (2002). Accordingly, SSA becomes a maximum, represented by the number of players in the team, if all players nominate the same set of cells as target cells. There is no shared awareness if each player nominates a unique set of cells as containing targets, in which case SSA = 1.
|
(2) |
Equation (2) assumes that task effectiveness described by the numerator accounts for both targets being hit and, to a lesser degree (expressed by the higher weight for hit), countermanding risks associated with potential collateral damage when cells not containing a target are being hit. Squaring the net gain accounts for the additional cost per shot, in the sense of time and effort to be spent for successful targeting, as the number of shots increases. Assuming time to be the decisive resource determining task efficiency, rather than the number of shots fired or the reconnaissance budget spent, reflects the importance of time sensitive targeting in a dynamic operational environment.
Data Analysis and Results
The data presented below are based on a sample that included a total of 574 officer cadets receiving initial military training at the officer school of the German Air Force and junior officers of all service branches receiving academic education at the Universität der Bundeswehr München. The sample consisted to 86.4 percent of males and 13.6 percent of females. 56.7 percent of the study participants had entered the Armed Forces only a few months before the data collection and thus had no prior military experience other than basic training. 43.3 percent had prior military service either as conscripts or NCO candidates qualifying for officer training of, on average, 14.94 months (s.d. = 10.7 months). The participants’ average age was 20.77 years (s.d. = 2.13 years). In the end, the results of 130 teams were available for analysis. The results reported in the following sections refer to the team level only.
For the simulation experiments, the participants were grouped into teams of four individuals each. For statistical analyses and hypothesis tests, the data on the team members’ individual characteristics were aggregated to the team level. The team values of the independent variables were calculated as the arithmetic average of the four team members’ individual values.
Independent Variables
Descriptive statistics of the independent variables at the team level are shown in Table 1, including the minimum and maximum values, average scores, and standard deviations.
Table 1. Descriptive statistics of independent variables at the team level.
Independent and control variables |
Min. |
Max. |
Average |
s.d. |
Z(a) |
MBTI® Extraversion vs. Introversion |
50.50 |
107.00 |
75.70 |
12.42 |
.59 |
MBTI® Sensing vs. Intuition |
62.00 |
119.00 |
93.42 |
10.40 |
.52 |
MBTI® Thinking vs. Feeling |
59.00 |
124.00 |
90.33 |
12.38 |
.53 |
MBTI® Judging vs. Perceiving |
65.00 |
122.00 |
90.33 |
13.24 |
.71 |
Locus of Control (internal) |
9.75 |
20.75 |
17.49 |
2.10 |
2.20** |
Ambiguity Tolerance |
2.28 |
3.43 |
2.83 |
.23 |
.50 |
Intellectual ability (numeral) |
15.00 |
35.00 |
25.74 |
4.33 |
.60 |
Intellectual ability (figural) |
7.25 |
15.50 |
11.11 |
1.86 |
.89 |
Age |
18.50 |
24.25 |
20.46 |
1.06 |
1.77** |
Gender (number of females) |
0 |
3 |
.51 |
.77 |
4.46** |
Social Cohesion |
1.62 |
5.81 |
4.18 |
.76 |
.91 |
Task Cohesion |
1.75 |
5.94 |
4.39 |
.77 |
.76 |
s.d. = standard deviation; (a) Kolmogorov-Smirnov-Z statistic for test of normal distribution:
Non-significant Z indicates normal distribution; significance levels: + p < 0.10; * p < .05; ** p < .01
Note that for the MBTI® dimensions values below 100 indicate a preference for Extraversion (E), Sensing (S), Thinking (T), and Judging (J), and, conversely, values above 100 indicate a preference for Introversion (I), Intuition (N), Feeling (F), and Perceiving (P). In addition to the calculation of descriptive statistics, each of the independent variables was tested for normal distribution. Table 1 shows that, except for Locus of Control, all independent variables could be considered as normally distributed, whereas, as expected, the control variables Age and Gender (number of females in the team) did not show normal distribution.
Team Performance Results
As the players had no or little experience with CAFFEINE, participants were provided some time to familiarize themselves with the basic game functions. Then participants were randomly allocated teams of four each without knowing who the other members of their teams were. The teams played the game twice without interruption, the first game with CRP available and the second with IRP only.
Table 2 shows the results of 130 teams, including minimum and maximum values, means, and standard deviations of the team performance measures for both experimental conditions (CRP and IRP). Performance scores (TEF) calculated by (2) and shared situational awareness (SSA) calculated by (1) represent the dependent variables in the subsequent analyses.
Table 2. Team performance measures (CRP // IRP).
|
Min. |
Max. |
Average |
s.d. |
T(a) |
Hits |
12 // 9 |
28 // 28 |
24.3 // 21.1 |
3.4 // 4.2 |
-8.52** |
Fail |
0 // 0 |
14 // 20 |
4.5 // 7.4 |
3.3 // 4.5 |
7.60** |
Time (sec) |
135 // 158 |
1053 // 1599 |
452 // 643 |
177 // 258 |
9.45** |
Chat |
0 // 0 |
65 // 156 |
17.6 // 28.4 |
12.8 // 19.0 |
9.18** |
Budget |
0 // 0 |
485 // 385 |
165 // 125 |
96 // 86 |
-5.26** |
TEF |
0.5 // 0.0 |
17.8 // 11.7 |
5.4 // 2.6 |
3.4 // 2.2 |
-10.13** |
SSA |
1.46 // 1.38 |
4.00 // 4.00 |
3.2 // 2.7 |
0.58 // 0.69 |
-7.44** |
(a) Statistics of the T-Tests for paired samples; ** p < .01
The results show significant differences between both experimental conditions. For example, with CRP teams scored 24.3 hits on average as compared to 21.1 with IRP only. In contrast, the number of shots at empty cells (Fail) ranged from 0 to 14 for CRP and 0 to 20 for IRP, resulting in a standard deviation of 3.3 and 4.5 respectively.
The relative frequency of the Task efficiency (TEF) over the entire sample is shown in Figure 3. The difference between the graphs underscores the above stated general advantage of CRP.
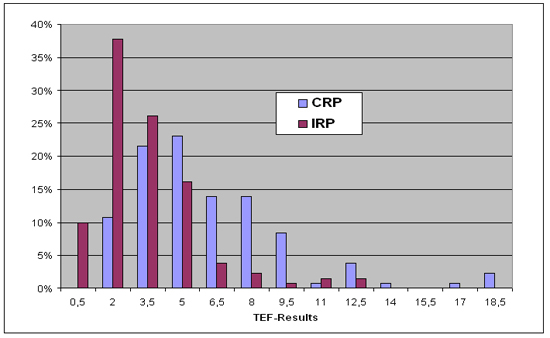
Figure 3. Task efficiency results for CRP and IRP.
Test of Hypotheses
Table 3 presents the zero-order correlations between all independent, control, and dependent variables including significance levels. Hypotheses on the relationships between independent variables and team performance were tested on the basis of the regression analyses compiled in Table 4.
Table 3. Correlations among dependent and independent variables.
Zero-order variable intercorrelations(a) |
1 |
2 |
3 |
4 |
5 |
6 |
7 |
8 |
9 |
10 |
11 |
12 |
13 |
14 |
15 |
1. MBTI® Extraversion-Introversion |
(.81) |
||||||||||||||
2. MBTI® Sensing-Intuition |
.28** |
(.67) |
|||||||||||||
3. MBTI® Thinking-Feeling |
.34** |
.25** |
(.81) |
||||||||||||
4. MBTI® Judging-Perceiving |
-.33** |
-.22* |
-.16+ |
(.82) |
|||||||||||
5. Locus of Control (internal) |
-.06 |
.07 |
-.06 |
-.12 |
(.74) |
||||||||||
6. Ambiguity Tolerance |
.04 |
.28** |
.17+ |
-.15+ |
.05 |
(.76) |
|||||||||
7. Intellectual ability numeral |
-.01 |
-.06 |
.19* |
.06 |
-.08 |
-.07 |
(.92) |
||||||||
8. Intellectual ability figural |
-.14 |
-.18* |
-.14 |
.07 |
-.07 |
-.05 |
.28** |
(.71) |
|||||||
9. Social Cohesion |
.19* |
.15+ |
.10 |
-.14 |
.20* |
.11 |
-.06 |
-.00 |
(.86) |
||||||
10. Task Cohesion |
.15+ |
.15+ |
.09 |
-.06 |
.16+ |
.08 |
-.10 |
.03 |
.88** |
(.81) |
|||||
11. Age |
.00 |
-.09 |
-.07 |
.12 |
-.40** |
-.05 |
.04 |
.02 |
-.14 |
-.09 |
|||||
12. # of females in the team |
.17* |
.14 |
.03 |
.05 |
-.04 |
.21* |
-.19* |
-.04 |
.08 |
-.02 |
-.16+ |
||||
13. TEF IRP |
.20* |
.08 |
.03 |
.01 |
.11 |
.07 |
-.07 |
.08 |
.31** |
.39** |
-.18* |
.03 |
|||
14. TEF CRP |
.22* |
.07 |
.07 |
.08 |
.19* |
-.04 |
.06 |
-.06 |
.27** |
.24** |
-.19* |
.04 |
.44** |
||
15. SSA IRP |
.15+ |
.17+ |
-.01 |
.06 |
.17+ |
.05 |
.01 |
.21* |
.46** |
.54** |
-.16+ |
-.06 |
.51** |
.28** |
|
16. SSA CRP |
-.03 |
.03 |
.03 |
.10 |
.15+ |
.05 |
.11 |
.03 |
.39** |
.47** |
-.11 |
-.11 |
.22* |
.50** |
.43** |
(a) Pearson correlation coefficients; significance levels (two-sided): + p < 0.10;
* p < .05; ** p < .01; scale reliability scores are reported in the principal axis.
Regression Results
To test the proposed hypotheses, the independent variables were regressed on the dependent variables using multiple regression analyses. This procedure simultaneously assesses the degrees to which each of the proposed predictors individually contributes to the variance of a given dependent variable. Table 4 reports the results of the regression analyses for the teams’ task efficiency (TEF), including the variables entered into the regression equation, the proportion of explained variance (R²), standardized beta weights, T statistics and related significance levels.
Table 4. Regression Results for Effects on Task Efficiency (TEF).
CRP |
IRP |
|||||||
Variables |
R² |
Beta(a) |
T |
Variables |
R² |
Beta(a) |
T |
|
(Absolute term) |
|
-.00 |
(Absolute term) |
.12 |
.01 |
|||
Extraversion- Introversion |
.30 |
3.07** |
Extraversion- Introversion |
.29 |
2.86** |
|||
Sensing- Intuition |
.03 |
.26 |
Sensing- Intuition |
.03 |
.27 |
|||
Thinking- Feeling |
-.01 |
-.12 |
Thinking- Feeling |
-.03 |
-.33 |
|||
Judging- Perceiving |
.22 |
2.38* |
Judging- Perceiving |
.14 |
1.51 |
|||
Locus of Control |
.16 | .17 |
1.81+ |
Locus of Control |
.07 |
.69 |
||
Ambiguity Tolerance |
-.03 |
-.38 |
Ambiguity Tolerance |
.09 |
.91 |
|||
Intellect. ability (num.) |
.07 |
.78 |
Intellect. ability (num.) |
-.11 |
-1.16 |
|||
Intellect. ability (fig.) |
-.04 |
-.44 |
Intellect. ability (fig.) |
.15 |
1.62 |
|||
Age |
-.16 |
-1.69+ |
Age |
-.18 |
-1.83+ |
|||
Gender(b) |
-.03 |
-.28 |
Gender(b) |
-.09 |
-.99 |
|||
(a) standardized beta weights; (b) number of females in the team;
+ p < 0.10; * p < .05; ** p < .01
Hypothesis 1 suggested a team’s average preference for Extraversion to be positively related to team performance. Since Extraversion refers to the “lower” end of the Extraversion-Introversion scale, this is the case if the coefficient of the correlation between Extraversion-Introversion and TEF is negative. Table 4 shows that Extraversion-Introversion reveals positive significant regression weights for CRP (![]() = .30, p < .01) and IRP (
= .30, p < .01) and IRP (![]() = .29, p < .01), which indicates that Extraversion is related to TEF, but in the opposite than the assumed direction. Thus, hypothesis 1 is not supported.
= .29, p < .01), which indicates that Extraversion is related to TEF, but in the opposite than the assumed direction. Thus, hypothesis 1 is not supported.
Hypothesis 2 suggested that Sensing, at the “lower” end of the dimension Sensing-Intuition, would be positively related to TEF. However, the results for both CRP (![]() = .03, n.s.) and IRP (
= .03, n.s.) and IRP (![]() = .03, n.s.) did not reveal a significant contribution of this variable to TEF variance. Hypothesis 2 is hence not supported.
= .03, n.s.) did not reveal a significant contribution of this variable to TEF variance. Hypothesis 2 is hence not supported.
Hypothesis 3 assumed a positive relationship between a team’s Thinking preference and TEF, but is not supported by the observed data (CRP: ![]() = - .01, n.s.; IRP:
= - .01, n.s.; IRP: ![]() = - .03, n.s.).
= - .03, n.s.).
Hypothesis 4, suggesting a positive relationship between a team’s Judging preference and task efficiency, was not supported since the positive regression weight of Judging-Perceiving points in the opposite than the hypothesized direction.
It is significant for CRP (![]() = .22, p < .05), but not for IRP (
= .22, p < .05), but not for IRP (![]() = .14).
= .14).
Hypothesis 5 proposed a positive relationship between team internality and task efficiency. The regression weights for internal Locus of Control were significantly positive for CRP at least at the .10 level (![]() = .17, p < .10), but not for IRP (
= .17, p < .10), but not for IRP (![]() = .07, n.s.). Thus, hypothesis 5 can be considered as partially supported.
= .07, n.s.). Thus, hypothesis 5 can be considered as partially supported.
Hypothesis 6 suggested an inverted-U-shaped relationship between a team’s Ambiguity Tolerance and task efficiency. However, this predictor had to be considered in a different manner. Even though the observed data for this variable were normally distributed (Table 1), the total sample average of 2.83 on the scale ranging from 1 to 6 indicates that the sample is biased to the lower end of the overall scale. It hence appeared less useful to assume that the observed data would show the inverted-U-shaped relationship with the team performance measures that had been hypothesized for data that would be normally distributed over the entire given scale. The observation that all observed data fall in the area below the center of the 1–6 scale suggests that a positive (linear) relationship within the range of the observed data would be compatible with the original hypothesis 6. We thus tested hypothesis 6 for a linear positive relationship between the observed Ambiguity Tolerance values and the team performance measures. Table 4 shows no significant positive regression weights for task efficiency in the CRP (![]() = - .03, n.s.), or IRP (
= - .03, n.s.), or IRP (![]() = .09, n.s.) condition.
= .09, n.s.) condition.
Hypothesis 7 assumed that a team’s social cohesion would be positively related to team performance. Table 3 shows that social cohesion was positively related to task cohesion to a highly significant degree (r = .88, p < .01). Thus, social and task cohesion seem to interact in producing positive effects on TEF, which makes it difficult to identify the isolated effects of either predictor. However, the positive correlations of social cohesion with TEF for CRP (r = .27, p < .01) and IRP (r = .31, p < .01) as well as of task cohesion with TEF for CRP (r = .24, p < .01) and IRP (r = .39, p < .01) support hypotheses 7 and 8.
Discussion
The results of the simulation games confirm the significant benefits of a common situational picture for collaboration in networked teams. Analysis of the team processes revealed that high performance teams were distinguished by parallel and “self-synchronized” allocation of search assets that required comparatively few interactions during the search phase to complete the game. In contrast, when no common operational picture was available well-performing teams had the tendency to adopt a search strategy where players allocated their search assets sequentially conditional to the results of the actions of the preceding players. Thus, one might conclude that unless a common situational picture is available networking might quickly degenerate into building de facto hierarchies for task processing. However, this need not necessarily be considered as a disadvantage because it could also be interpreted as a sign of a team’s agility.
As regards the impact of the individual and team variables on team performance measures, the results show that Locus of Control, Social Cohesion, and Task Cohesion were positively related to the performance measures, whereas Extraversion and Judging were negatively related to team performance. Subject to the findings of a later qualitative evaluation of the team communication protocols, a number of key conclusions can be drawn from the respective quantitative analysis.
Extraversion – Introversion
New types of communication media require that criteria for personnel selection be reviewed. Contrary to expectations, teams with a tendency toward Extraversion (which represented the majority in the sample) do not communicate as efficiently as teams with a tendency toward Introversion, given that online text chat will be the preferred communication medium for collaboration of networked teams. Current operational experience suggests that responsiveness in a complex mission environment requires a high degree of parallel information processing, which is more easily performed by text chat than voice chat preferred by extraverted teams.
Judging – Perceiving
Complex and dynamic operational environments require cognitive flexibility. Teams with a preference for Perceiving performed better than teams with a preference for Judging. The implication for future C2 in networked environments is that cognitive flexibility in terms of staying open for new information and a willingness to spontaneously adapt to changes in a complex and dynamic environment (i.e., a preference for Perceiving) appears to be superior to the tendency to act in an organized and decisive manner and to reach conclusions early in the decision process (i.e., a preference for Judging), which has been prioritized in traditional C2. Thus, in addition to a change in staffing policies, a major cultural change may be required to adapt to scenarios of the twenty-first century.
Locus of Control
Agile organizations imply flat hierarchies where decision rights are widely distributed to self-organizing networked teams. This requires team members to display substantial degrees of action orientation, which is fostered by a team’s belief to be in control of the outcomes of their actions (high degree of Internality). Although this belief is a generalized expectancy, it can to some extent be enhanced through the experience of one’s own competence. A corresponding implication referring to training and leadership is to provide teams with an appropriate performance feedback and thus to support emergence of a sense of team efficacy.
Social Cohesion
Social cohesion is a strong promoter of team performance. In our experiments, this has been shown to be true even for randomly compiled “ad hoc” teams that were given hardly any preparation time. This implies that, from the very beginning of a team process, emergence of social cohesion is an invaluable asset for future performance and thus bonding should be promoted by team leaders in a sensible way.
Task Cohesion
The results stress the significance of task cohesion for team performance. This points to the importance of shared commitment to the team goal and, more generally, to the super-ordinate mission purpose. The more future C2 relies on delegating decision rights to “the edge,” the more future staffing and training efforts need to focus on preparing team members not only for their tactical or operational task, but also on helping them to develop a sense of understanding of the strategic significance of the mission.
These conclusions are highly relevant for a role-dependent definition of personnel selection and staffing criteria, education and training, and team building.
Way Ahead
It should be pointed out that the research presented in this paper merely scratches the surface of what needs to be done to better understand the implications of human factors for command and control of networked operations. For one thing, they need further clarification on the basis of a qualitative evaluation of the collaboration behaviour captured by the numerous chat messages sent in the collaboration experiments. In addition, the research results raise a number of questions that need to be given high priority including, among others, the degree to which task complexity affects team performance; the impact of intercultural differences on collaboration in multinational teams and between teams of different nations; and the degree to which team collaboration is affected by mission-specific training and/or field experience of team members.
Acknowledgments
The research discussed above was funded by the Office of the Assistant Secretary of Defense for Networks and Information Integration (OASD/NII), through its Command and Control Research Program (CCRP), and coordinated by the Naval Postgraduate School’s Center for Edge Power under contract No. N00244-06-C-0003. The German Ministry of Defense authorized arrangements to make the requisite test population available from students of the Officer Schools of the German Armed Forces.
Footnotes
- Team size of four was considered as an appropriate compromise between the number of test participants available and the desired interaction levels in the teams.
- Total weighted score: WTS = 20* hit – 10* fail – time [20sec] – ChatMsg – budget
References
- Amthauer, R., B. Brocke, D. Liepmann, and A. Beauducel. 2000. Intelligenz-Struktur-Test 2000 R. Göttingen: Hogrefe.
- Barrick, M.R., G.L. Stewart, M.J. Neubert, and M.K. Mount. 1998. Relating member ability and personality to work-team processes and team effectiveness. Journal of Applied Psychology 83(3): 377-391.
- Barry, B., and G.L. Stewart. 1997. Composition, process and performance in self-managed groups: The role of personality. Journal of Applied Psychology 82(1): 62-78.
- Beal, D.J., R.R. Cohen, M.J. Burke, and C.L. McLendon. 2003. Cohesion and performance in groups: A meta-analytic clarification of construct relations. Journal of Applied Psychology 88(6): 989-1004.
- Boone, C., W. Van Olffen, and A. Van Witteloostuijn. 2005. Team locus-of-control composition, leadership structure, information acquisition, and financial performance: A business simulation study. Academy of Management Journal 48(5): 889-909.
- Bradley, J.H., and F.J. Hebert. 1997. The effect of personality type on team performance. Journal of Management Development 16(5/6): 337-353.
- Carless, S., and C. De Paola. 2000. The measurement of cohesion in work teams. Small Group Research 31(1): 71-90.
- Chan, D. 1998. Functional relations among constructs in the same content domain at different levels of analysis: A typology of composition models. Journal of Applied Psychology 83: 234–246.
- Chang, A., and P. Bordia. 2001. A multidimensional approach to the group cohesion–group performance relationship. Small Group Research 32(4): 379-405.
- Colman, A.M. 2003. A dictionary of psychology. Oxford, NY: Oxford University Press.
- Furnham, A., and T. Ribchester. 1995. Tolerance of ambiguity: A review of the concept, its measurement and applications. Current Psychology 14(3): 179-199.
- Furnham, A., and H. Steele. 1993. Measuring locus of control: A critique of general, children's, health- and work-related locus of control questionnaires. British Journal of Psychology 84: 443-479.
- Gardner, W. L., and M. J. Martinko. 1996. Using the Myers-Briggs Type Indicator to study managers: A literature review and research agenda. Journal of Management 22(1): 45-83.
- Huber, R.K., and P. Eggenhofer. 2005. Transformation der Bundeswehr: Intellektuelle und kulturelle Herausforderungen. In Deutsche Sicherheitspolitik – Rückblick, Bilanz und Perspektiven, (ed.) R.C. Meier-Walser, 92-104. München: Hanns Seidel Stiftung.
- Janis, I.L. 1982. Groupthink. Boston: Houghton Mifflin.
- Jones, P.E., and P.H.M.P. Roelofsma. 2000. The potential for social contextual and group biases in team decision-making: biases, conditions and psychological mechanisms. Ergonomics 43(8): 1129-1152.
- Jung, C.G. 1921. Psychologische Typen. Zürich.
- Karau, S.J., and J.W. Hart. 1998. Group cohesiveness and social loafing: Effects of a social interaction manipulation on individual motivation within groups. Group Dynamics 2(3): 185-191.
- Kendall, E. 1998. MBTI® European English Edition Step I. Manual Supplement. Mountain View, CA: Consulting Psychologists Press.
- Kroeger, O., and J.M. Thuesen. 1992. Type talk at work. New York, NY: Delacorte Press.
- Lauriola, M. and I.P. Levin. 2001. Relating individual differences in attitude toward ambiguity to risky choices. Journal of Behavioral Decision Making 14(2): 107-122.
- MacDonald, A. 1970. Revised scale for ambiguity tolerance: Reliability and validity. Psychological Reports 26: 791-798.
- Mathieu, J.E., G.F. Goodwin, T.S. Heffner, E. Salas, and J.A. Cannon-Bowers. 2000. Influence of Shared Mental Models on Team Process and Performance. Journal of Applied Psychology 85(2): 273-283.
- Myers, I.B. 1993. Introduction to type. 5th ed. Palo Alto, CA: Consulting Psychologists Press.
- Myers, I.B., and M.H. McCaulley. 1992. Manual: A guide to the development and use of the Myers-Briggs Type Indicator. Palo Alto, CA: Consulting Psychologists Press.
- Norton, R. 1975. Measurement of ambiguity tolerance. Journal of Personality Assessment 39: 607-619.
- Nunnally, J. C. 1967. Psychometric theory. 2nd ed. New York, NY: McGraw-Hill.
- Postmes, T., R. Spears, and S. Cihangir. 2001. Quality of decision making and group norms. Journal of Personality & Social Psychology 80(6): 918-930.
- Reber, A.S., and E. Reber. 2001. The Penguin dictionary of psychology. 2nd ed. London: Penguin Books.
- Rotter, J.B. 1966. Generalized expectancies for internal versus external control of reinforcement. Psychological Monographs 80(1): Whole No. 609.
- Schäfer, S. 2005. Collaborative game for first experiences in a networked environment (CAFFEINE) – ein vernetztes Planspiel zur Unterstützung der Ausbildung in NetOpFü. Internal paper for the Bundeswehr (in German).
- Stahl, M., and J. Loughran. 2002. Exploring joint force command and control concepts using SCUDHunt (Final Report). Available via http://www.scudhunt.com
- Thatcher, A., and A. De La Cour. 2003. Small group decision-making in face-to-face and computer-mediated environments: The role of personality. Behaviour & Information Technology 22(3): 203-218.
- Twitchell, D.P., K. Wiers, M. Adkins, J.K. Burgoon, and J.F. Nunamaker, Jr. 2005. StrikeCOM: A multi-player online strategy game for researching and teaching group dynamics. Proceedings of the 38th Hawaii International Conference on System Sciences.
- Wellens, A.R. 1993. Group situation awareness and distributed decision making: From military to civilian applications. In Individual and Group Decision Making: Current Issues, (ed.) N. J. Castellan, 267-287. Hillsdale: Erlbaum.